PE Architectural · fan/system diagnosis
High fan static pressure and low airflow: test the system curve
Calculate a changed fan duty point at fixed speed, then use measured resistance evidence to select a responsible troubleshooting action.
Reviewed for the current ReasonSpan™ exam profile · Updated October 11, 2026By the ReasonSpan™ editorial team · Our content standards
State what stays fixed
At fixed speed and air density, a fan has the supplied curve Δp = 1,200 − 100Q² Pa, with Q in m³/s. Initially the system requires Δp = 200Q². After a change, its resistance curve is 500Q². All three curves use the same fan static-pressure basis. A single duct static-pressure reading is not this duty pressure. These are hypothetical curves with coefficients defined for the stated units; assume stable operation at their intersections.
01 · Equipment view
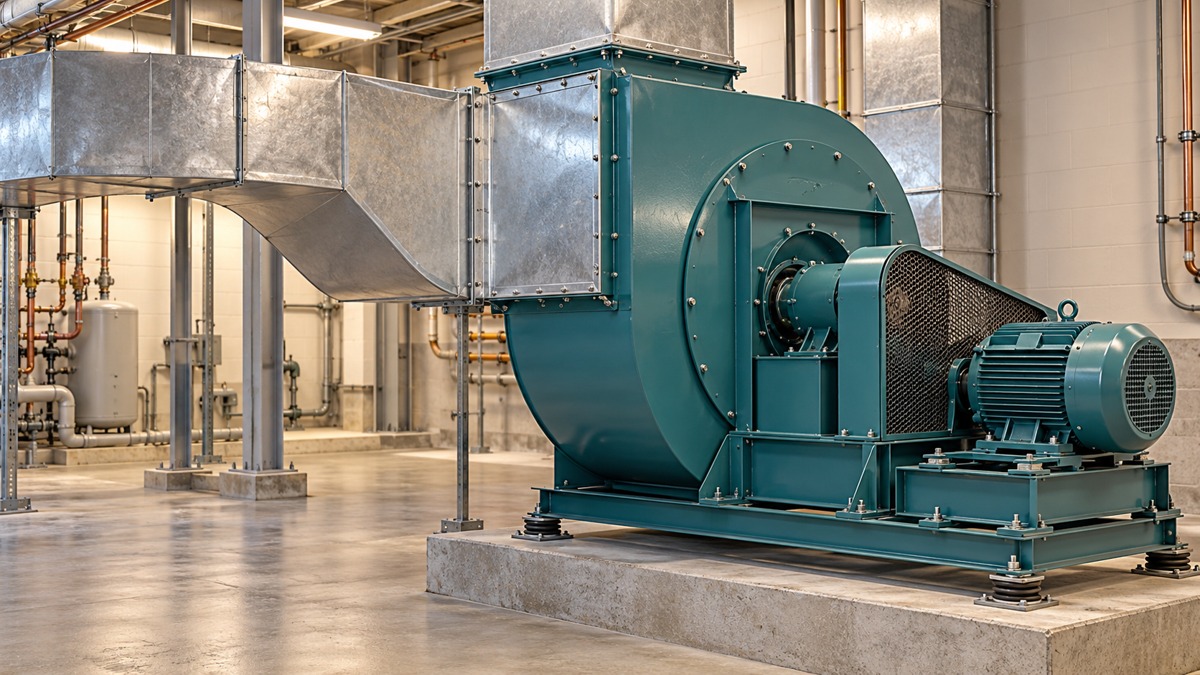
Centrifugal fan · drive · connected ductwork
The equipment view identifies the fan and drive. The schematic includes the filter and damper used to investigate system resistance.
02 · Exam-style model
Same fan speed and density; only the supplied system resistance changes. Circle A marks the original point; square B marks the changed point.
Original teaching figure. The schematic and stated givens define the model; the 3D view illustrates the hardware. These are not actual examination exhibits.
Find both intersections
Initially, 1,200 = 300Q², so Q = 2.00 m³/s and Δp = 800 Pa. After the change, 1,200 = 600Q², so Q = 1.414 m³/s and Δp = 1,000 Pa. Lower flow with higher fan pressure is consistent with higher system resistance in this model.
| Operating state | Airflow Q (m³/s) | Fan static pressure Δp (Pa) |
|---|---|---|
| A · Original resistance | 2.000 | 800 |
| B · Increased resistance | 1.414 | 1,000 |
Use the measurement to choose the next investigation
First confirm fan speed, air density and the pressure-measurement basis. Then compare component differential pressures with the baseline at the measured flow. Higher filter differential pressure despite the lower flow supports increased filter resistance, so inspect the filter and its installation first. Check damper position, obstructions and measurement locations as the evidence indicates. The curve intersection alone does not identify a particular fault.
After correcting an identified restriction, remeasure flow and pressure and compare them with the expected duty point. If a speed change is proposed, evaluate the revised curve and equipment limits. Increasing speed before identifying the restriction can increase power demand, noise and pressure while retaining the cause; the present curves do not quantify input power. Reducing the reported flow target only changes documentation. Replacing a motor based on airflow alone skips the fan/system evidence.
Distinguish curve intersection from affinity-law use
At the same fan geometry and air density, the affinity laws relate corresponding fan-curve points as Q ∝ N, Δp ∝ N² and shaft power ∝ N³ under their similarity assumptions. Those ratios do not directly relate duty points on two different system-resistance curves. For a proposed speed change, construct or obtain the new fan curve and re-intersect it with the actual system curve.
These are original instructional givens, separate from timed mocks. State assumptions before calculating and check the source edition required for your exam or project.
Sources and further reading
Exam requirements can change. Confirm current details with the organization that administers your exam and use the cited sources for the preparation principles summarized here.