Read the evidence. Choose the method. Make the decision.
Connect construction charts and tables to compatible quantity bases, complete load boundaries and defensible field decisions.
Explore the original visual lessons and method cards below. Your existing program access includes 32 saved exercises, including 12 fresh transfer problems. Twelve response-format drills per program cover numeric entry, select-two, matching and graphic regions.
Original authored teaching material. Use your authorized examination references to rehearse the actual chart geometry, search headings and listed standards for your exam.
Keep the method beside your answer.
The full exercise sequence is included with existing access to this program. Sign in to use your entitlement.
Cover the explanation and state the method in your own words. Revisit a card after a missed problem, then apply it to a fresh question.
Method 1
Name the boundary
What crosses the chosen boundary? What stays inside?
Draw the room, plant, branch or construction quantity boundary. Name where every energy, mass or load contribution acts.
Reveal a check on the reasoning
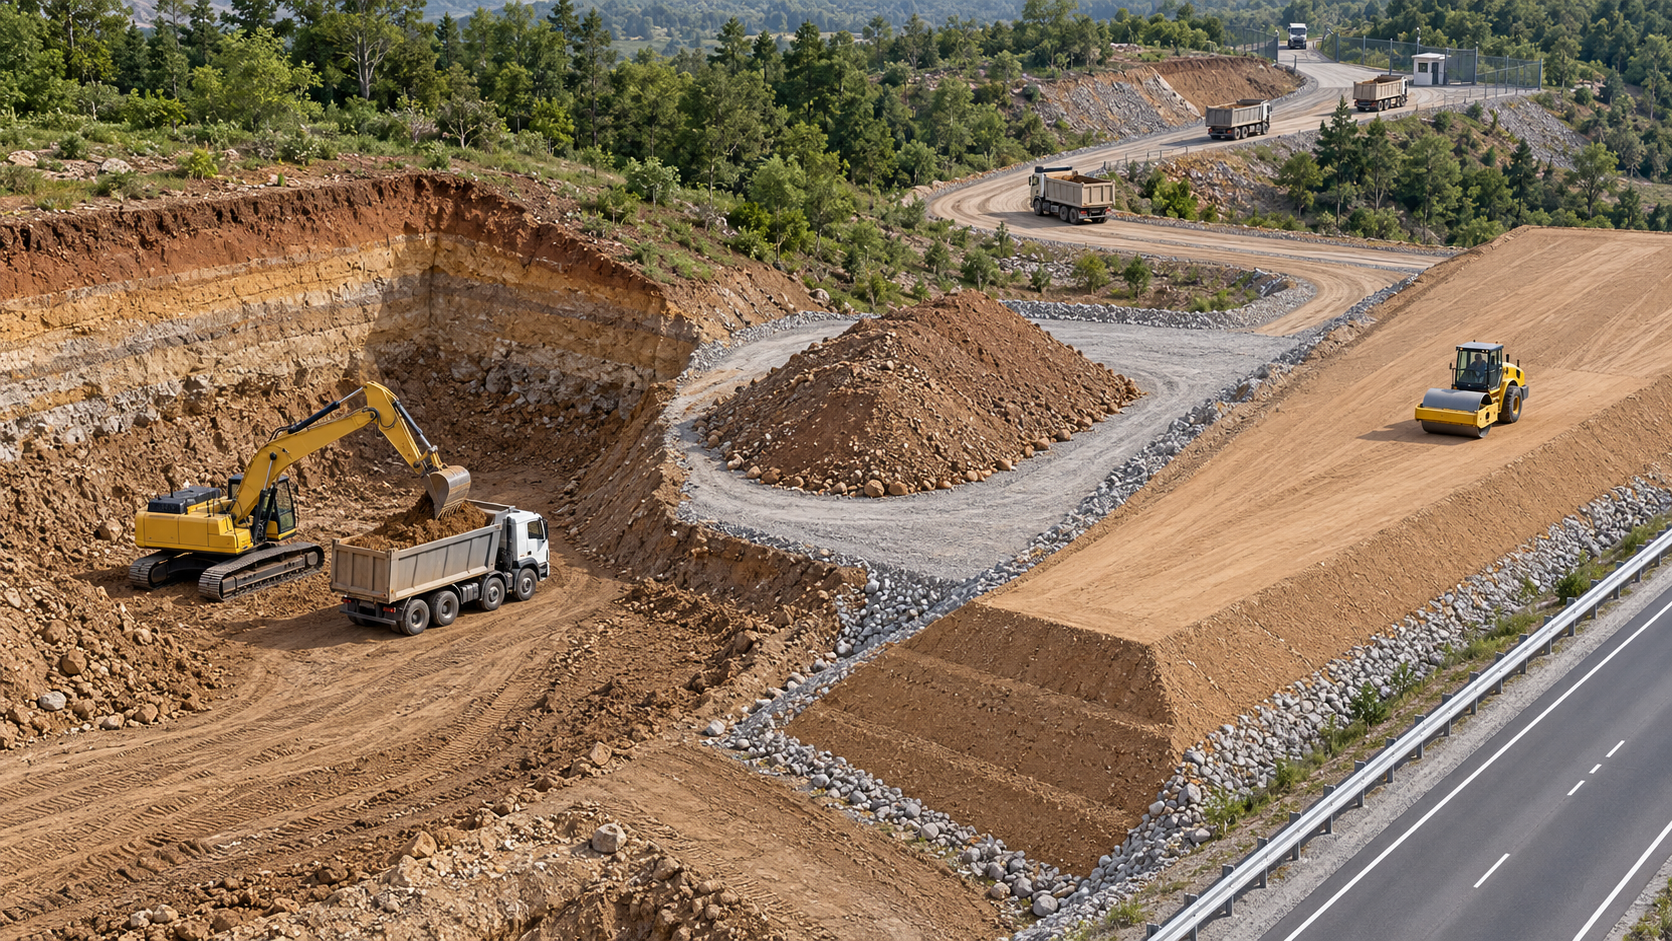
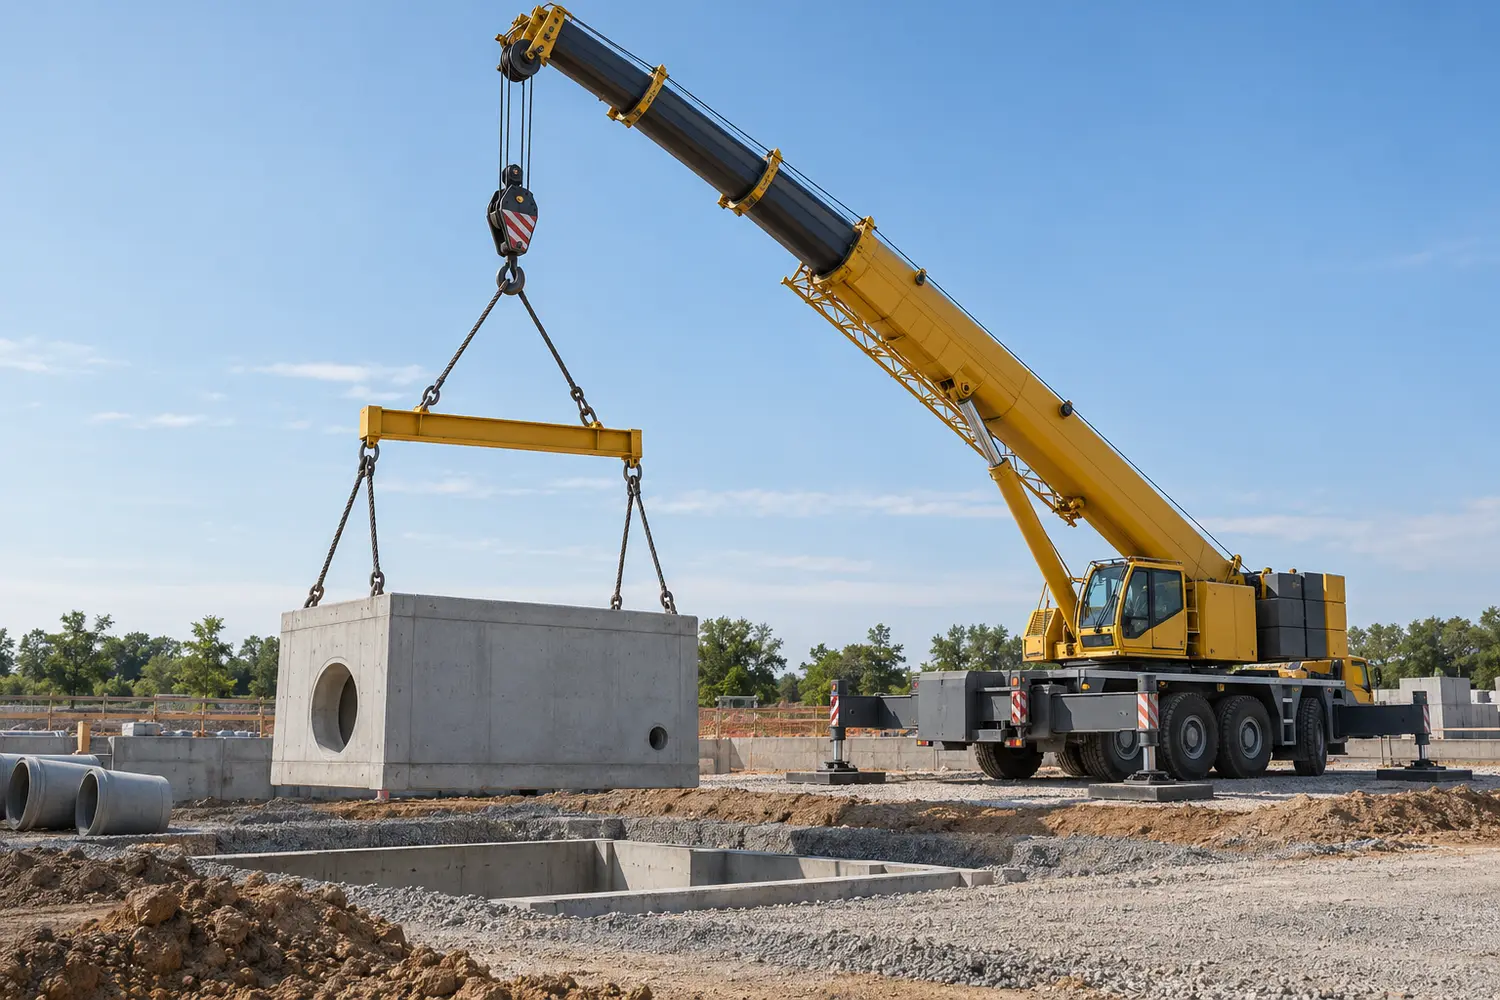
Define the material stockpile or suspended-load boundary. Include every stated input and output before comparing quantities.
Method 2
Fix the quantity basis
Are these quantities comparable before you combine them?
Write units beside every input. Identify actual or standard airflow, dry-air or total mass, dry or moist soil and bank, loose or compacted volume.
Reveal a check on the reasoning
Moist field unit weight requires water content before comparison with the laboratory dry maximum.
Method 3
Find the governing constraint
Which requirement limits the proposed design?
Calculate independent capacity, safety or performance limits separately. Enforce all required lower and upper bounds.
Reveal a check on the reasoning
A lift must satisfy the supplied configuration rating at every radius, including the suspended hook and rigging.
Method 4
Read, estimate, then verify
What should the sign and approximate magnitude be?
Read chart labels and pressure first. Estimate before calculating. Preserve enough precision internally and report a justified result.
Reveal a check on the reasoning
A chart reading is an estimate. Do not distinguish answers more finely than the plotted scale supports; numeric training tolerances are exercise-specific.
Content quality and review
These original exercises have undergone internal technical and software checks. View the review scope, completed checks and remaining validation steps. Suggested working times are study guides.